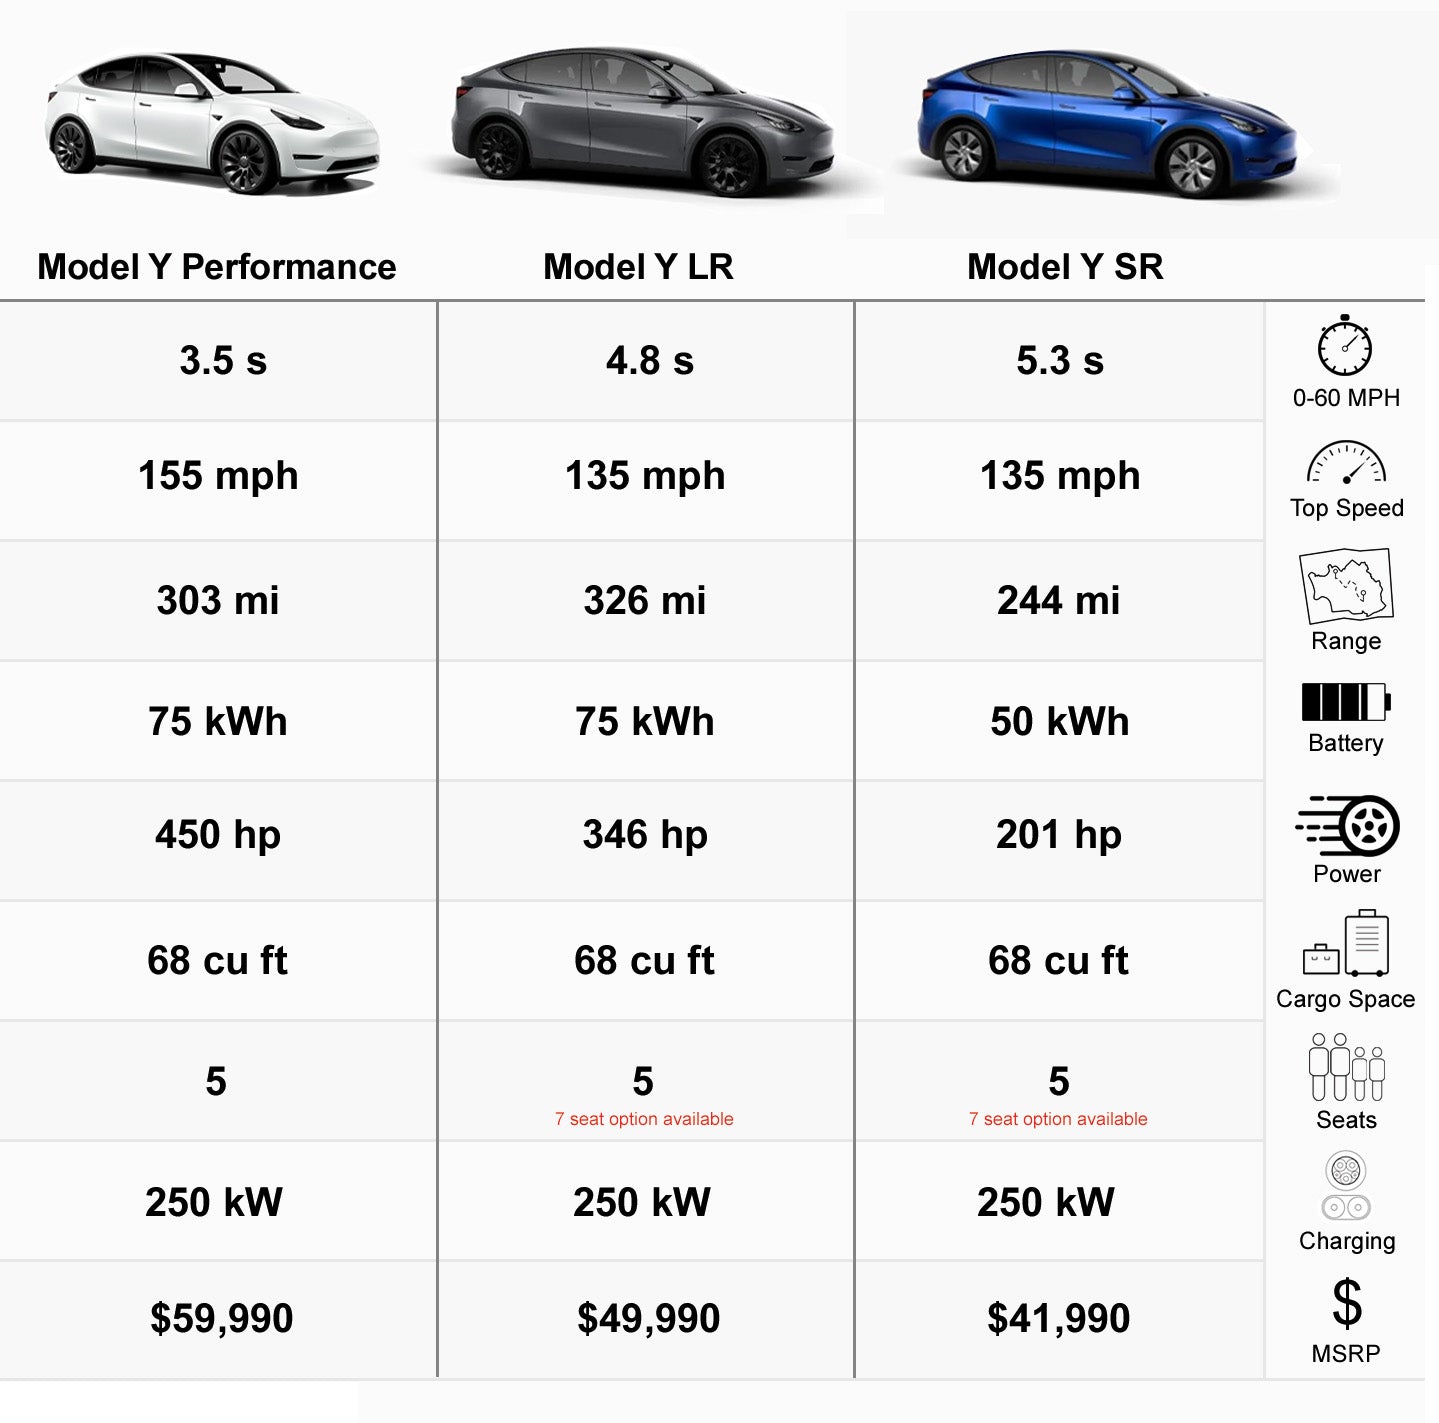
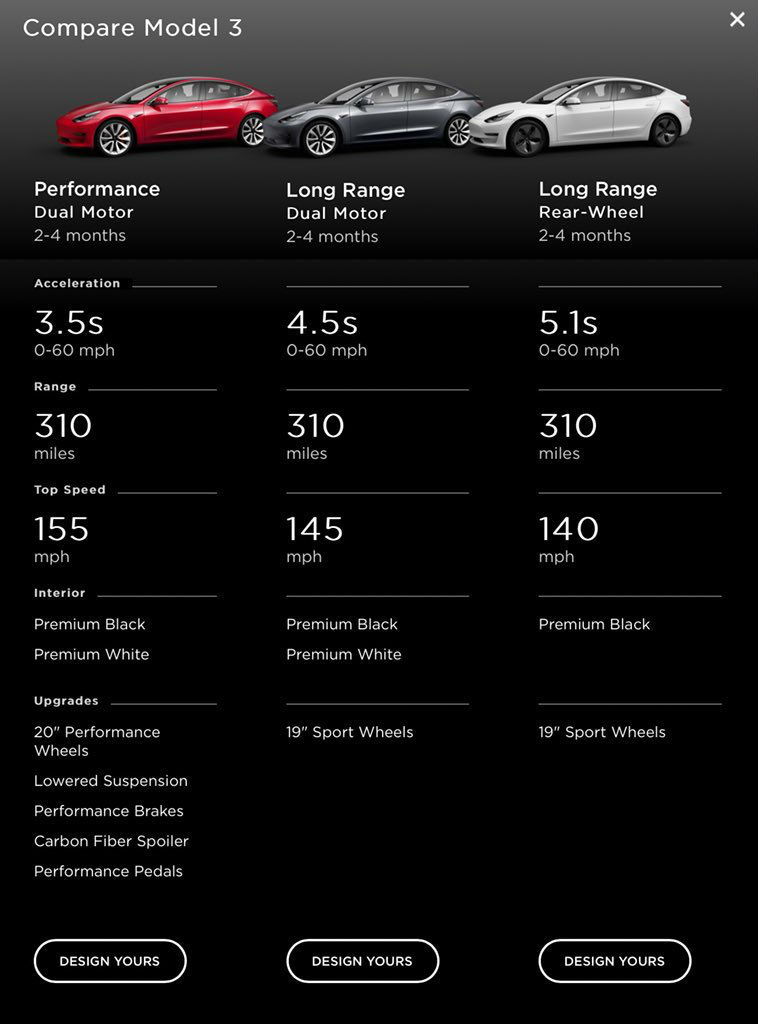
The Tesla Model Comparison Chart isn’t just a grid of numbers—it’s a revelation. For years, the electric vehicle landscape has been shrouded in ambiguity, where range figures blur with fine print and 0-60 mph claims dance around reality. But what if you could strip away the noise and see, at a glance, which Tesla truly aligns with your ambitions? Whether you crave the raw immediacy of acceleration or the serene confidence of endurance, this chart promises to reframe your understanding of what an EV can deliver. It doesn’t just compare models; it exposes the hidden trade-offs, the silent compromises, and the unexpected triumphs that define Tesla’s lineup. Buckle up—this isn’t just data. It’s a roadmap to electrification done right.
The Illusion of Uniformity: Why Every Tesla Isn’t Created Equal
At first glance, the Tesla lineup appears deceptively uniform. Sleek silhouettes, minimalist interiors, and that signature acceleration curve suggest a family resemblance. Yet beneath the surface, each model is a carefully calibrated experiment in compromise. The Model 3, for instance, isn’t merely a smaller Model S—it’s a study in prioritization. Where the Model S sacrifices some range for blistering speed, the Model 3 trades outright performance for efficiency. The Dual Motor variant splits the difference, offering all-wheel drive without the sticker shock of the Plaid’s ludicrous setup. This isn’t just a matter of preference; it’s a fundamental divergence in philosophy. One model chases the horizon, while another obsesses over the next traffic light. The chart lays bare these distinctions, forcing you to confront a question most EV shoppers avoid: What do you value more—the thrill of instant torque or the peace of mind that comes with a 350-mile buffer?
Consider the range disparities. The Model Y Long Range doesn’t just outpace its Standard sibling—it redefines what an SUV can be. While the base Model Y struggles to crack 260 miles, its long-range counterpart sails past 300, a difference that transforms a cross-country road trip from a endurance test into a mere pit stop. Yet this isn’t merely a story of bigger batteries. It’s a testament to aerodynamics, software optimization, and the alchemy of Tesla’s proprietary heat pump. The chart doesn’t just list these figures; it contextualizes them, revealing how a few extra miles can mean the difference between a weekend getaway and a daily commuter’s nightmare.
0-60 mph: The Brutal Honesty of Acceleration
Acceleration isn’t just a spec—it’s a statement. In the world of internal combustion engines, 0-60 mph is a flex, a number to be whispered in dimly lit garages. Tesla, however, treats it with the reverence of a sacred rite. The Plaid’s sub-2-second sprint isn’t just fast; it’s a violation of physics as we’ve known it. But speed, like range, is a double-edged sword. The Model S Plaid doesn’t just embarrass supercars—it exposes the fragility of their existence. Yet for every driver who craves this kind of ferocity, there’s another who winces at the thought of a tire-shredding launch every time the light turns green. The chart forces this confrontation head-on, presenting acceleration not as a bragging point but as a spectrum of human desire. Where does your threshold lie?
What’s often overlooked is how Tesla’s software plays a role in these figures. The ability to modulate torque delivery isn’t just about raw power—it’s about control. The Model 3 Performance, for example, doesn’t just hit 0-60 mph in 3.1 seconds; it does so with a precision that makes every launch feel like a controlled explosion. This is where the chart transcends mere numbers. It reveals that acceleration isn’t a binary—it’s a continuum, and Tesla has mastered the art of tuning it to the driver’s whim. Whether you prefer the surgical strikes of the Plaid or the measured urgency of the Long Range, the chart ensures you’re not just buying a car. You’re selecting a temperament.

The Price Paradox: What You Pay vs. What You Get
Money, in the world of Teslas, is a language all its own. The base Model 3 might whisper promises of affordability, but the fine print reveals a truth few dealerships will admit: the real cost of entry is measured in compromise. A $40,000 sticker price doesn’t account for the $8,000 upgrade to Long Range, nor does it factor in the $5,000 premium for a Performance variant that still can’t touch the Plaid’s blistering pace. The chart doesn’t just list these prices—it dissects them, exposing the hidden tiers of ownership. A Model Y, for instance, starts at $47,740, but the Long Range version demands nearly $60,000. Is the extra 50 miles of range worth the 25% markup? The answer isn’t in the spec sheet; it’s in the driver’s soul.
Yet price isn’t just about upfront costs. It’s about the long game. The Model S, with its stratospheric starting price, offers a return on investment that’s as much about prestige as it is about performance. The Plaid’s $130,000 tag isn’t just a number—it’s a bet on exclusivity, a wager that the thrill of 2.1-second launches is worth more than a college fund. The chart forces you to confront these trade-offs, not as abstract dilemmas but as concrete realities. Every dollar spent is a vote for a future where your car is more than transportation—it’s an extension of your identity. The question isn’t whether you can afford a Tesla. It’s whether you’re willing to pay the price of admission to a new era of driving.
The Unseen Variables: Efficiency, Charging, and the Art of Compromise
Range and acceleration are the headline grabbers, but they’re only half the story. Efficiency, often relegated to the footnotes of spec sheets, is the silent assassin of EV ownership. A Model 3 Long Range might boast 358 miles of range, but that figure assumes a gentle right foot and a 70-degree day. Push the accelerator to the floor, and the same battery that promised a weekend adventure now becomes a source of anxiety. The chart doesn’t just list efficiency ratings—it contextualizes them, revealing how real-world conditions can turn theoretical numbers into pipe dreams. A 20% drop in range isn’t just a statistic; it’s the difference between a stress-free road trip and a frantic hunt for a Supercharger.
Charging infrastructure, too, is a silent disruptor. The Model S Plaid’s 250 kW peak charging rate is a marvel—until you realize that not every Supercharger can deliver it. The chart lays bare the chasm between promise and reality, forcing you to ask: Is your daily route dotted with 250 kW stalls, or will you be relegated to the slower lanes of the charging network? Even the humble Model Y, with its modest 170 kW peak, becomes a study in pragmatism. It’s not just about how fast you can fill the tank; it’s about where you can do it without surrendering to the tyranny of range anxiety.
The Final Reckoning: Which Tesla Aligns With Your Ambition?
The Tesla Model Comparison Chart isn’t a tool—it’s a mirror. It reflects not just the capabilities of each model, but the aspirations of the driver behind the wheel. The Model 3 Standard Range might appeal to the budget-conscious commuter, but it’s a far cry from the Model S Plaid’s promise of automotive transcendence. The Model Y Long Range offers a middle ground, a compromise between practicality and performance. Yet the chart doesn’t just present these options; it challenges you to interrogate your own desires. Do you crave the raw, unfiltered power of the Plaid, or the quiet confidence of a Long Range sedan that can cross state lines without a second thought? Is your heart set on the minimalist elegance of the Model 3, or does the Model X’s falcon-wing doors whisper promises of a different kind of freedom?
The answers aren’t in the numbers. They’re in the spaces between them. The chart doesn’t just compare Teslas—it compares versions of yourself. The driver who dreams of launching into the stratosphere. The one who values the serenity of a full charge every morning. The pragmatist who sees a car as a tool, and the enthusiast who sees it as an extension of their soul. This isn’t just a purchase decision. It’s a declaration of intent. Choose wisely.