Some numbers feel deceptively tidy—particularly the “10–80%” window that appears in many charging comparisons. It sounds like a clean, measurable sprint: press the pedal, plug in, watch the battery climb, and walk away with a faster schedule. Yet the moment you compare electric crossover charging times on DC fast charging, a familiar observation surfaces: the journey from 10% to 80% often looks dramatically smoother than the ride from 0% to 100%, or even from 10% to 90%. Why does that happen? And why do people become so fascinated with these curves, even when the differences between models look small on paper?
Below is a careful look at electric crossover charging time comparison for DC fast charging in the 10–80% range—what changes, what remains stubborn, and what those numbers hint at beneath the surface.
Why the 10–80% window became the unofficial benchmark
The “10–80%” framing is not arbitrary; it’s practically a lens. In the low state of charge, the battery is often hungry—electrochemical processes can accept higher power without triggering aggressive protective limits. As charge rises, internal resistance, thermal behavior, and voltage constraints begin to negotiate with the charger. By stopping at 80%, many comparisons avoid the steep, late-stage taper that can dominate total time at higher SOC levels.
Short sentences matter here because the physics matters. The battery does not charge like a straight line. It charges like an intelligent system that constantly asks: “Can I safely accept this much power right now?” The 10–80% interval tends to maximize the period when the answer is frequently “yes.”
That’s also why this benchmark attracts attention. It offers a kind of “fair fight” between vehicles, chargers, and battery chemistries. People want comparability more than they want perfect realism.
DC fast charging: power is offered, not guaranteed
DC fast charging may look like a one-way feed of energy, but it’s more like a negotiation. The charger supplies current within its capability, yet the battery controller decides the actual acceptance rate. That decision is influenced by temperature, cell balancing strategy, voltage targets, and the battery’s health profile.
Even within the 10–80% range, that negotiation produces variability. Two crossovers can both be “charging at 150 kW,” yet one may taper sooner because its thermal management is working harder, or because its battery chemistry reaches a voltage ceiling earlier at the same SOC.
So when you compare charging times, the question isn’t only “How fast can the charger go?” It’s also “How fast does the vehicle let the battery receive?”
Electric crossover realities: the battery pack is not the only story
Electric crossovers often prioritize packaging efficiency and ride comfort, which shapes how much space is available for battery cooling hardware and heat spreaders. That hardware influences whether the battery stays within an optimal temperature band during DC charging.
Imagine two vehicles with identical battery capacities. One has a cooling strategy tuned for repeated fast-charging sessions. The other may be perfectly adequate for occasional charging, but its temperature rise becomes the limiting factor sooner. In a 10–80% comparison, temperature constraints can compress the middle of the curve—making the ramp feel slower than expected even if the initial acceptance looks impressive.
Then there’s the vehicle’s architecture: conductor sizing, power electronics, and the efficiency of the onboard charging path all affect net charge rate. Some crossovers “burn off” energy in conversion losses—heat that then has to be managed.
Short and sharp: the pack is central, but the system decides the outcome.
Temperature: the quiet variable that reshapes the curve
Temperature is frequently the deeper reason behind seemingly inconsistent charging comparisons. When a battery is too cold, the chemistry moves sluggishly and the system limits current to protect cells. When it’s too hot, the system also limits—this time to protect longevity and avoid accelerated degradation.
In the 10–80% window, temperature influences both the duration of high-power acceptance and the onset of taper. A crossover that arrives at the DC charger with a preconditioned battery may sustain higher power longer. Another vehicle—same model year, similar capacity—may arrive with a colder pack and experience a delayed uptake, stretching the time even if the charger itself is capable.
That’s why fascination persists: people can see the headline numbers, yet their lived experience depends on ambient conditions, trip history, and whether preconditioning was activated.
Battery chemistry and voltage ceilings: why taper starts before you think
Charging power is tightly tied to the battery’s voltage behavior. As SOC increases, cell voltage rises, and near the upper targets the battery’s acceptance becomes constrained. Even if the charger is “still ready,” the battery controller often throttles power to avoid overshoot and to maintain safe charge conditions.
Different chemistries can reach these constraints at different rates. Some packs exhibit more gradual taper; others drop power more quickly. In a 10–80% comparison, you may still see taper variability, because “80%” is not a universal physical condition—it’s a reported estimate that may map differently across battery management systems.
Moreover, internal resistance evolves with temperature and SOC. That means two crossovers can behave similarly early on, then diverge in the later half of the 10–80% window.
Cell balancing and calibration: the invisible choreography
Charging speed is not only about power; it’s also about precision. Battery management systems may perform cell balancing actions to ensure uniform state-of-charge across the pack. Balancing is not always the dominant force during fast charging, but it can influence how the vehicle allocates energy and how aggressively it maintains power.
There’s also the question of “accuracy.” If the battery estimate is off—because of recent driving, prior charging patterns, or sensor drift—the controller may adjust its charging profile as it recalibrates the pack. That can create a subtle mismatch between what the car predicted and what the charger delivers in real time.
These are not dramatic, cinematic effects. They are quiet mechanisms, but they can explain why one crossover appears consistently faster on paper yet not always on the road.
Charger behavior and site constraints: the infrastructure factor
DC fast charging comparisons often treat the charger as a constant actor. In reality, charger output can be affected by power sharing among multiple stalls, grid limitations, cable and connector characteristics, and even charging session history.
If your chosen crossover is plugged into a station where nearby ports are simultaneously active, the available power might be reduced. The impact can show up inside the 10–80% interval as a flatter ramp, earlier taper, or both.
Even the connector standard and the vehicle’s handshake procedure can matter. When negotiations start—protocol exchange, voltage alignment, safety verification—the outcome can influence how promptly the battery reaches its peak acceptance rate.
How to read a 10–80% charging comparison chart correctly
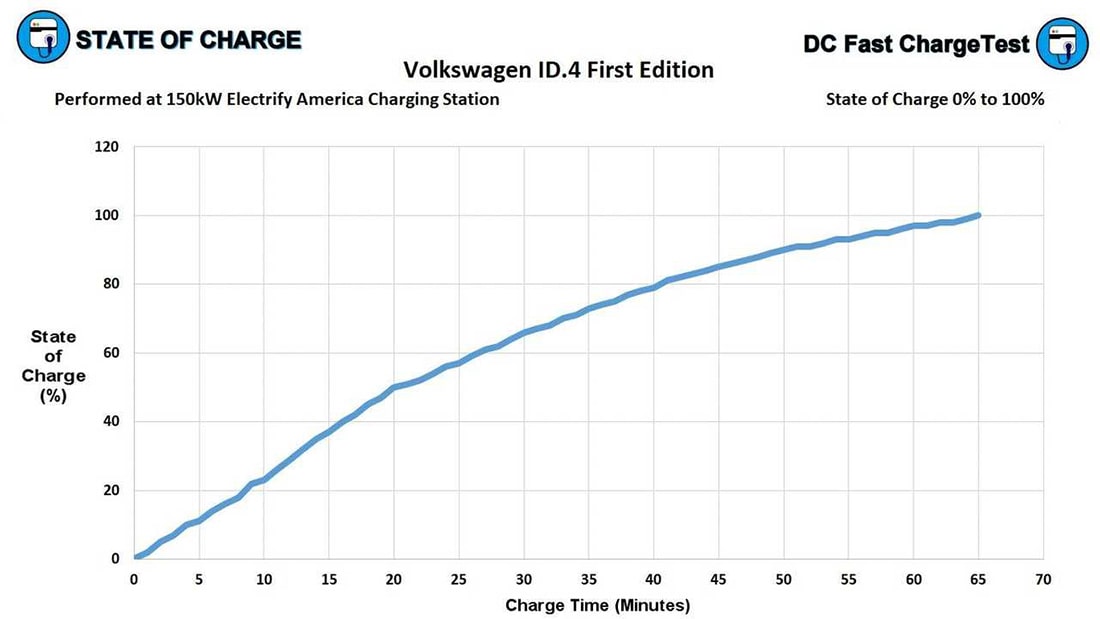
Look for three signals. First, the initial ramp: how quickly does the vehicle reach its peak charge power? Second, the plateau: does it hold a high acceptance rate through the middle of the SOC band? Third, the taper shape: does power decline gently or aggressively as the pack approaches 80%?
Do not overinterpret a single data point. Charging time is an integral, not a snapshot. Two vehicles may complete 10–80% within a close range while still having different charge profile personalities—one may front-load speed, the other may distribute it more evenly.

That’s also why drivers develop preferences. Some want the “arrival sprint,” others want predictable power to minimize variability during a road trip.
Practical expectations: what a driver actually feels
In daily use, the difference between 10–80% times can influence whether a charging stop feels routine or stressful. The human brain notices time gaps differently depending on context. A ten-minute difference can seem modest when you’re grabbing coffee. It can feel substantial when you’re trying to stay on schedule for a destination with fixed timing.
The fascination with comparisons comes from control. People hope that a charging profile will behave like a reliable timetable. Yet the true story is dynamic: the battery is adapting, the thermal system is calculating, and the charger is responding to the network.
Still, the 10–80% benchmark helps. It reduces the “noise” of extreme SOC behavior and highlights how vehicles tend to manage the portion of charging that most drivers experience during typical stops.
Long-term perspective: speed versus longevity
Fast charging is not only a performance metric; it’s also a stress test for the battery system. Even if two crossovers show similar 10–80% times, their long-term strategies can differ. Some may achieve peak power more aggressively, which can be beneficial for immediate convenience but may encourage more conservative behavior in subsequent sessions. Others may trade a touch of peak power for smoother thermal comfort and potentially better consistency across repeated charging.
This is where “fascination” becomes more than curiosity. Enthusiasm turns into stewardship—because the fastest option today might not always be the best pattern tomorrow.
Conclusion: the 10–80% story is about control, not just speed
Electric crossover charging time comparisons in the 10–80% DC fast charging range reveal more than who can add the most electrons per minute. They show how battery controllers interpret safety thresholds, how thermal systems keep the pack within its comfort zone, and how charging infrastructure participates in the outcome.
The common observation—faster, smoother charging in the 10–80% band—holds a deeper message. It suggests that this window aligns with the battery’s best compromise between chemical kinetics, voltage constraints, and protection logic. That alignment is precisely why the numbers captivate: they promise a predictable experience, even though the underlying reality is constantly calculating.
So the next time you compare charging times, look beyond the headline. Track the ramp, the plateau, and the taper. Consider temperature, preconditioning, and power-sharing. In that deeper reading, the fascination makes sense—and the comparison becomes far more useful than a single stopwatch.